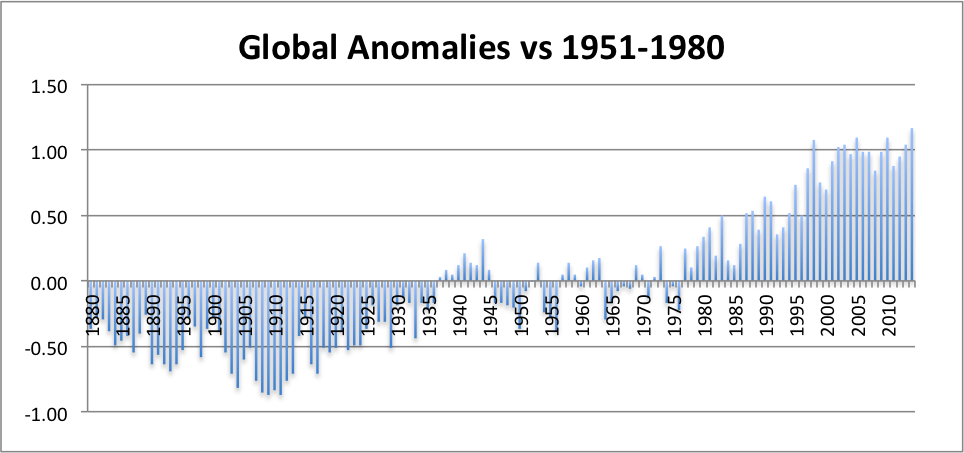
Yesterday, NOAA released their analysis of global temperatures for 2014. The first graph below shows the global annual temperature anomalies from 1880 to 2014, relative to the average temperature during the 1951-1980 base period. As has been widely reported, 2014 set a new record for the highest global temperature since NOAAs records began in 1880. This was especially unusual since 2014 was not an El Nino year; if it had been, that would have made temperatures even higher. Records were not set in 2014 in the US or in Maine, due to the cooling influence of the arctic vortex, but many other parts of the world were unusually warm.
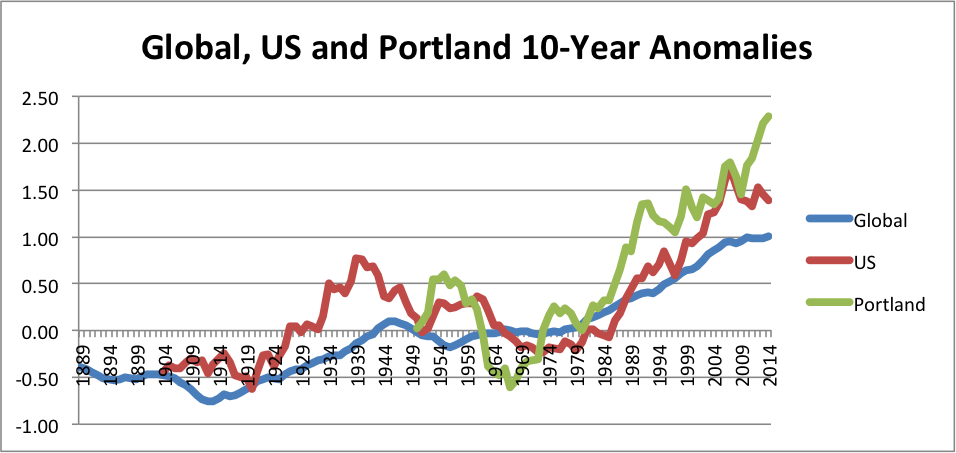
The second graph shows the 10 year average anomalies for Portland, total contiguous US and global, all based on NOAA data. There are larger fluctuations in temperature for Portland and US, compared to global, and recent decades have been even warmer here; the latest 10-year average anomaly for Portland is more than twice the worldwide anomaly, as it is now at 2.29 degrees, compared to 1.00 degree for the globe (and 1.39 degrees for the US).
The second graph shows the 10 year average anomalies for Portland, total contiguous US and global, all based on NOAA data. There are larger fluctuations in temperature for Portland and US, compared to global, and recent decades have been even warmer here; the latest 10-year average anomaly for Portland is more than twice the worldwide anomaly, as it is now at 2.29 degrees, compared to 1.00 degree for the globe (and 1.39 degrees for the US).
 RSS Feed
