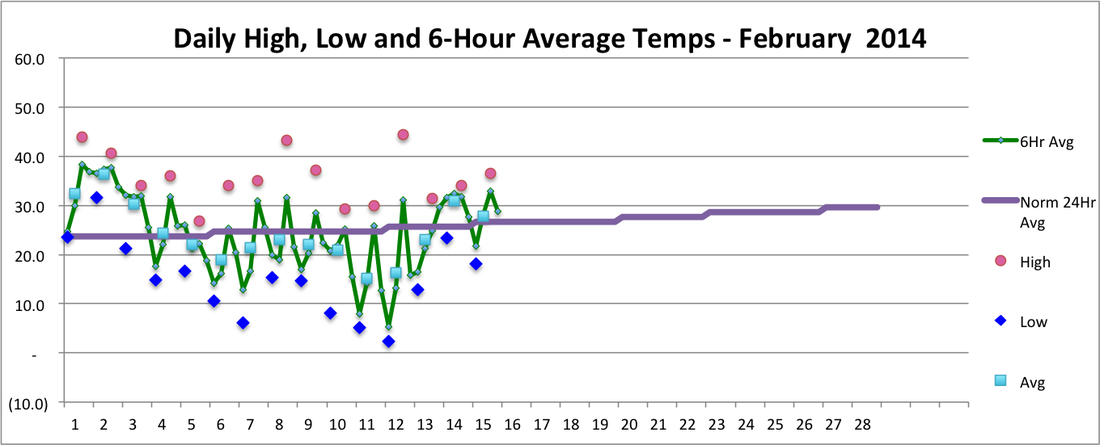
Slightly colder than normal so far this month with lots of snow: another 21" so far, to bring our total for the winter to 60". The most unusual day so far was the 12th, which had both the highest and lowest temps of the month (44 and 2)!
|
Slightly colder than normal so far this month with lots of snow: another 21" so far, to bring our total for the winter to 60". The most unusual day so far was the 12th, which had both the highest and lowest temps of the month (44 and 2)!
0 Comments
Temperatures were much closer to normal starting on the 25th, but we still ended up with 16 days of temperatures more than 10 degrees above or below normal, as shown in the first chart below. Since these were evenly divided between unusually warm and cold days, the month ended up just about at normal. The actual figure was about 0.1 degrees below normal for the month, only the 9th colder than normal month in the last 37, as shown in the second chart below. We have had only one month with temps more than 2 degrees colder than normal during that period, while we have had 17 months with temps more than 2 degrees warmer than normal. 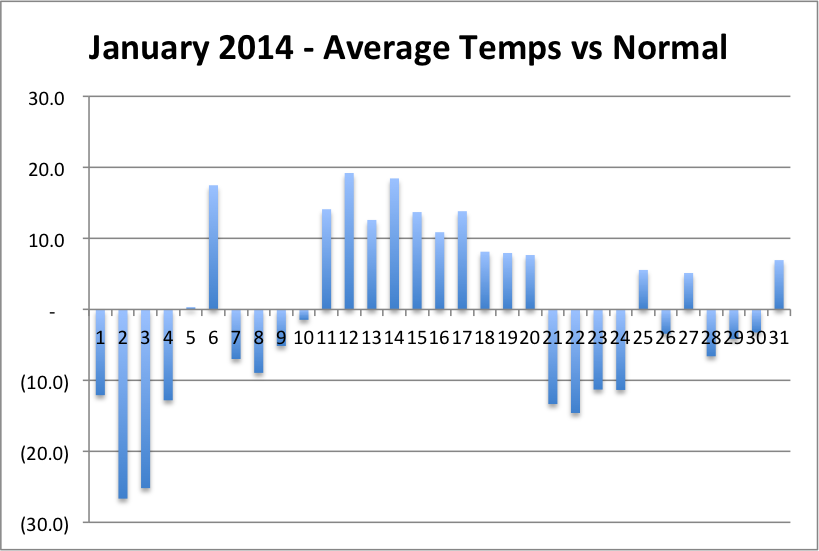 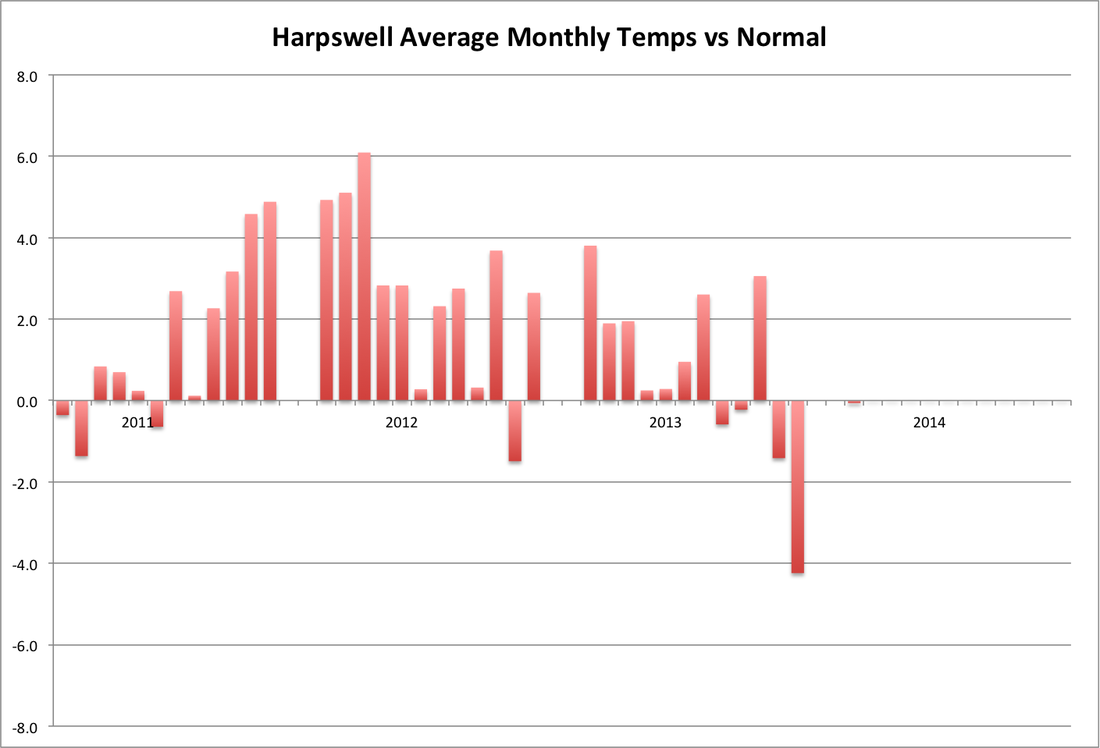 The chart below shows days with temperature extremes (more than 10 degrees different than normal) for each month last year. January was the month with the most such days, so perhaps this is a trend. (I'll check out the prior two years in my database when I have a chance.) It is also interesting to note that there were only 3 extreme days from April to September but there were 34 in the first and fourth quarter (evenly divided between unusually warm and unusually cold days). 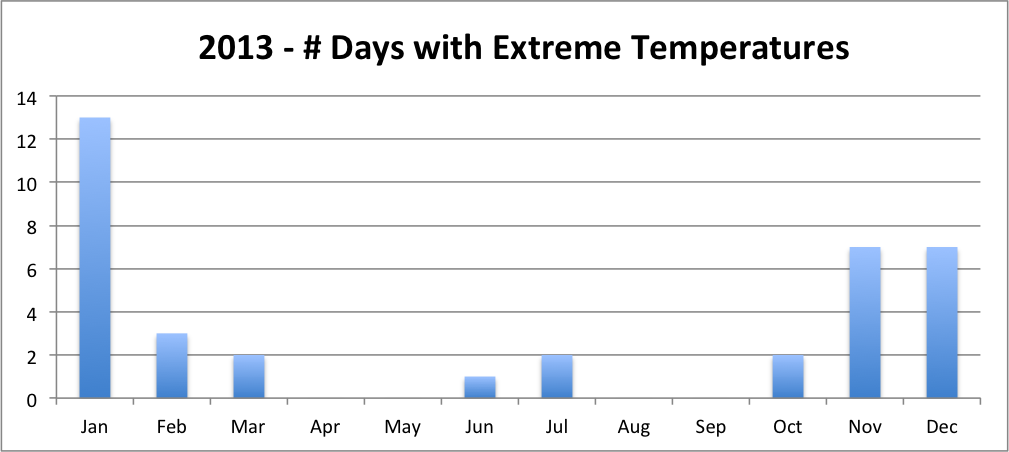 Finally, the daily temperature chart for January, 2014 shows again the extreme swings in temperatures. A variation of about 59 degrees between our low on the 4th and our high on the 6th! 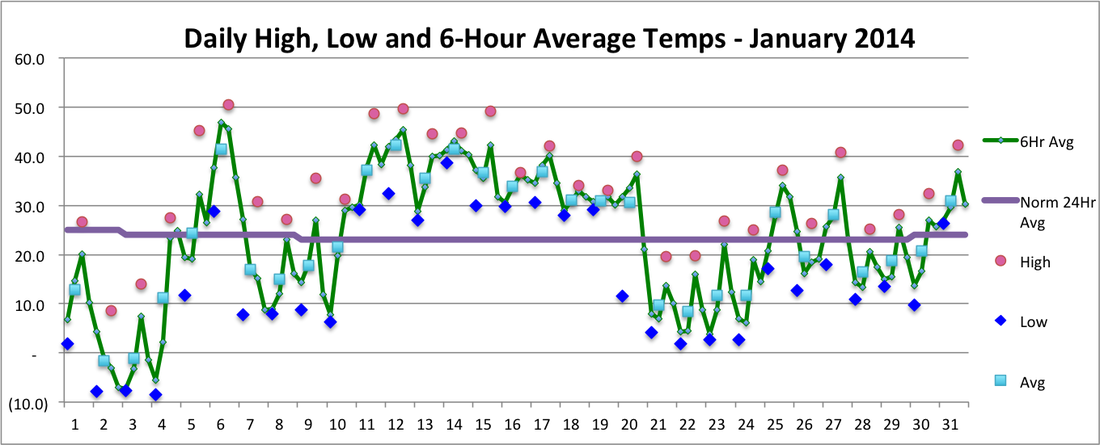 |
SOURCEWeather statistics are based on 5-minute readings at an Ambient Weather station near Mill Cove off of upper Harpswell Sound. Archives
December 2015
Categories |
 RSS Feed
