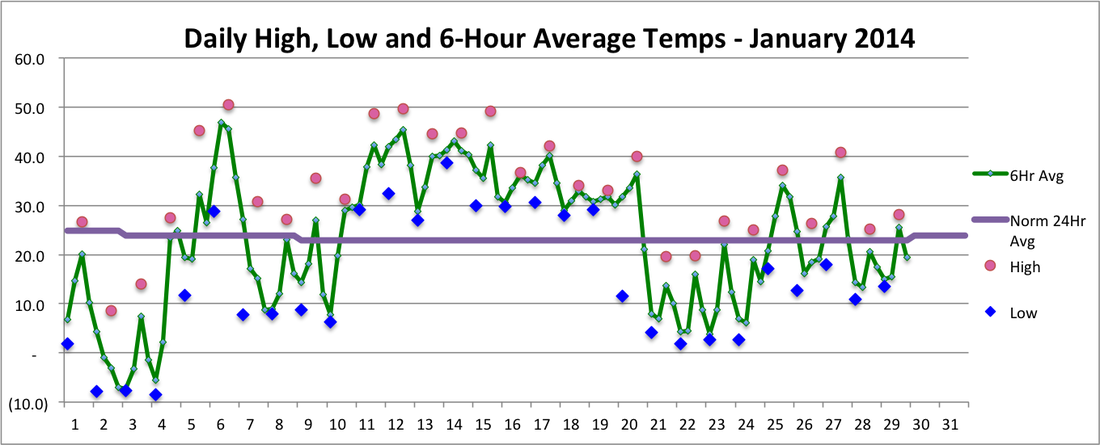
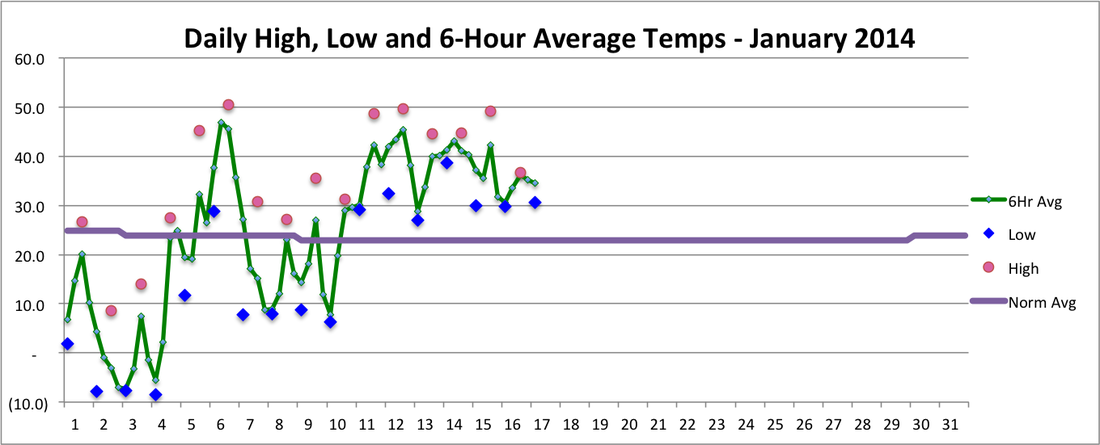
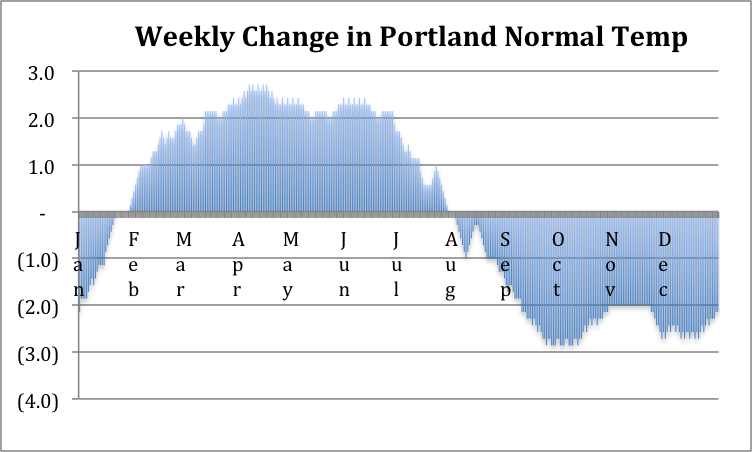
We have officially passed the dead of winter! Today, the normal average temperature in Portland goes up one degree from 22 to 23. The normal, which is based on the Portland climate from 1971-2000, has been flat since January 9th after having steadily declined since August 3rd. The purple line below shows the normal daily temperatures in Harpswell (which are slightly higher than Portland in winter and slightly lower in summer) compared to actual Harpswell highs, lows and 6-hour averages. We are now on the upswing toward summer that will continue until the peak normal temperature from July 17th until August 2nd. Of course, daily weather in Maine often varies significantly from the climatological averages so we probably won't notice that we are on the upswing right away but its nice to know that nature is now on our side pushing for warmer weather. Interestingly, the middle of the coldest period of winter is about a month after the shortest day, and the middle of warmest period of summer is about a month after the longest day.
0 Comments
Yesterday was a very windy day in Harpswell, so I thought it would be interesting to see how it compares to other windy days in the past 3 years. We had a maximum gust of 44.1 mph, which is second only to the 47.2 mph gust we had on January 31st, 2013 (in the 3 years I have had a weather station). On average, it was only the 5th windiest day in the past 3 years, mainly because there were some calm periods. What is a windy day? Well, there seems to be no meteorological definition, so I define it as a day with an average gust of at least 10 mph. It has to be fairly windy most of the day for this to happen, and it only happens about 8% of the time at my weather station. Yesterday, the average gust was 18.5 mph. The windiest day, on average, at my station was also January 31st, 2013, with an average of 22.7. That high number was helped by the fact that the minimum gust that day was 9.8 mph. It is a rare day that doesn't have at least one wind gust reading of zero (my station takes readings every 5 minutes); on average this only happens about once a month. The 9.8 mph minimum was the highest ever at my station. The chart below shows the readings throughout each of the 5 windiest days. January 31st, 2013 was the only day that had gusts averaging over 20 mph for the whole day. Yesterday was averaging around 25 mph through noon, but the afternoon and evening wasn't windy enough for it to join the over 20 club. It is easier to separate the days by looking at hourly averages...
December was by far the coldest month, relative to normal temperatures, in the 3-year history of my weather station. In Portland, where the National Weather Service has a much longer history, it was the coldest month relative to normal since 2007. Still, it was only the 8th colder than normal month of the last 36 in Harpswell.
Temperatures for the first half of January are just about normal despite most days being either significantly colder than normal or significantly warmer than normal. Through the 16th, we had 11 days with extreme temperatures: 7 days at least 10 degrees warmer than normal and 4 days at least 10 degrees colder than normal. In December, we had a total of only 7 days with extreme temperatures for the whole month.
Lately I’ve been fascinated by the average temperatures for Portland, and how much they change from week to week. We are obviously on the downward slope, temperature-wise, and have since early August been gradually getting colder. We are now approaching the period of fastest downward movement in temperatures. Since yesterday, our normal temps are getting about 2 degrees colder each week. By September 19th, we will be losing about 3 degrees a week for the next month. New England weather being what it is, our actual temps usually fluctuate wildly around the norm, though August was incredibly “normal” with no days more than 5 degrees from the norm. Yesterday was the warmest day relative to normal since July 20th, 9 degrees above normal in Portland, which will make the inevitable slide toward cold seem like a bigger change. But there is always something to look forward to: on January 30th, our average weekly temps will start climbing again!
Daily high temp in the graph below is shown above the afternoon average (noon - 6pm). Daily low temp is shown below the night average (midnight - 6am). The high and low usually occur during those time periods, but not always. For example, on the 22nd, the high temp of 32.5 occurred just after midnight and temps dropped the rest of the day. On the 12th, temps declined in the morning and afternoon to a low temp of 10.0 around 6pm after which the wind picked up and temps rose.
Our high for the month was 52.5 on the 3rd and our low was -4.4 on the 17th. The average temp for the month was 25.7, over 4 degrees below the normal of 29.8, but well above the record low December of 1989 in nearby Portland, when the average temp was 14.1 there according to the National Weather Service. |
SOURCEWeather statistics are based on 5-minute readings at an Ambient Weather station near Mill Cove off of upper Harpswell Sound. Archives
December 2015
Categories |