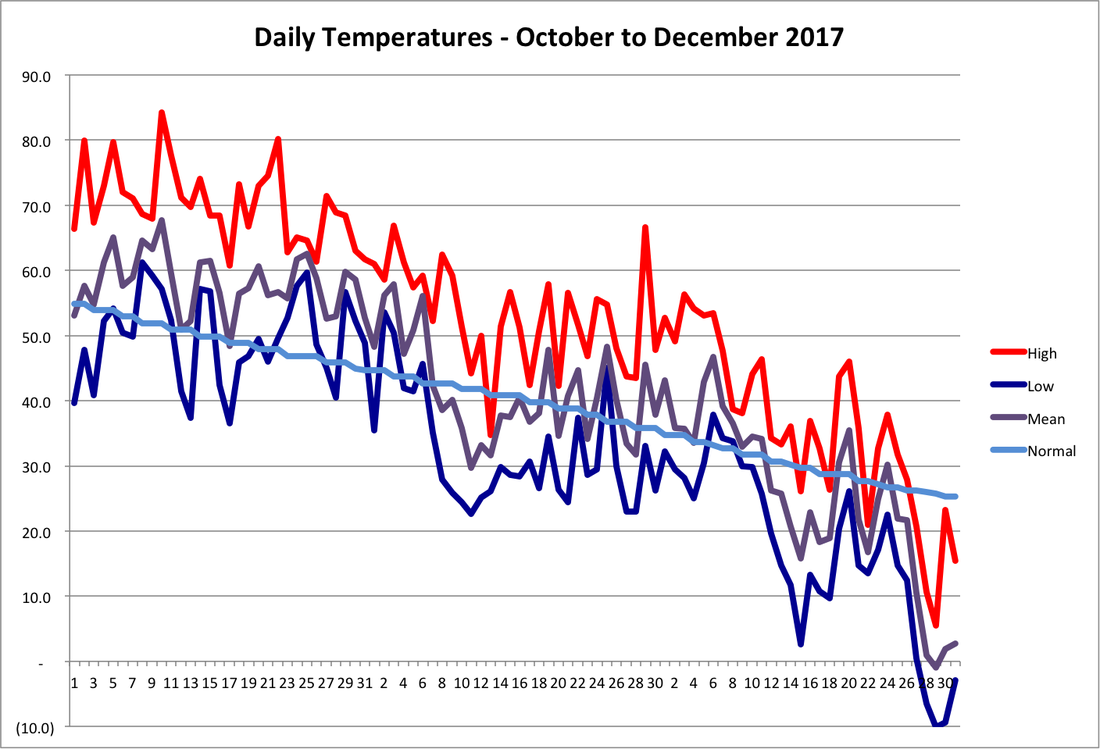
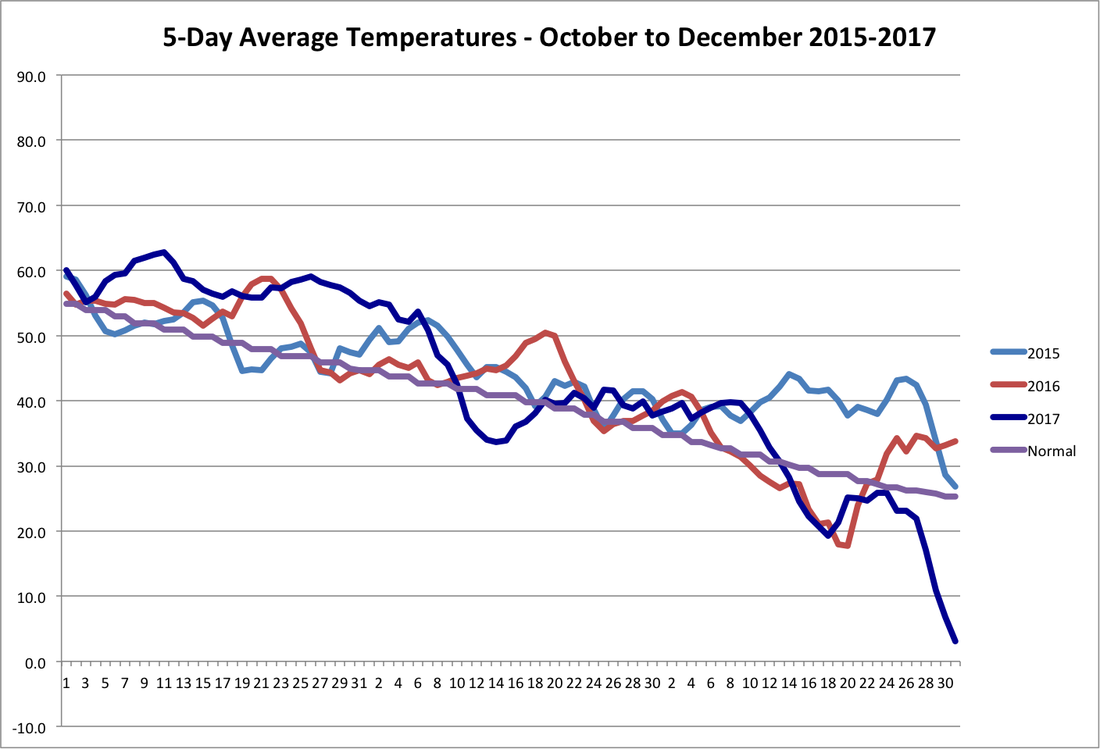
After a very warm October, we finally had our first frost on November 8th. The remainder of November and the first week of December brought fairly normal temperatures, before we had some increasingly wintery weather through year end. The second graph shows 5-day average temperatures for the 4th quarter of the last three years. The 5-day average in 2017 fell from an above normal 40 degrees on December 9th to a frigid 3 degrees at the end of the year. That was the lowest 5 day average in the 7 years I have had my weather station here in Harpswell.
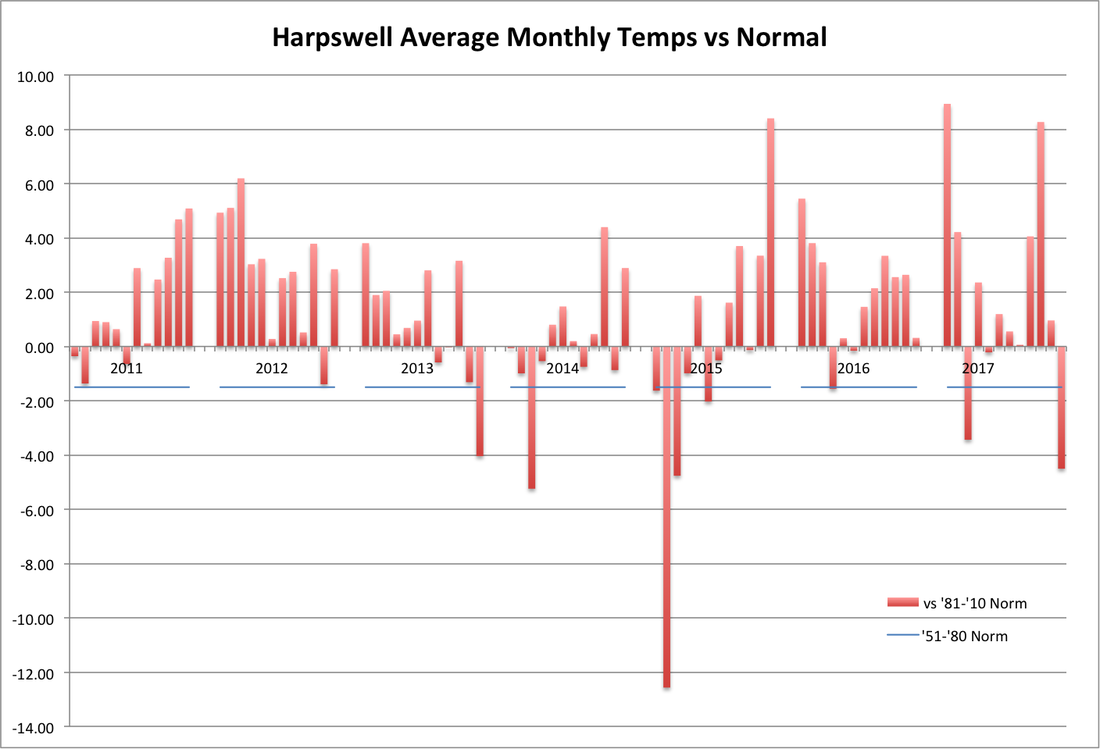
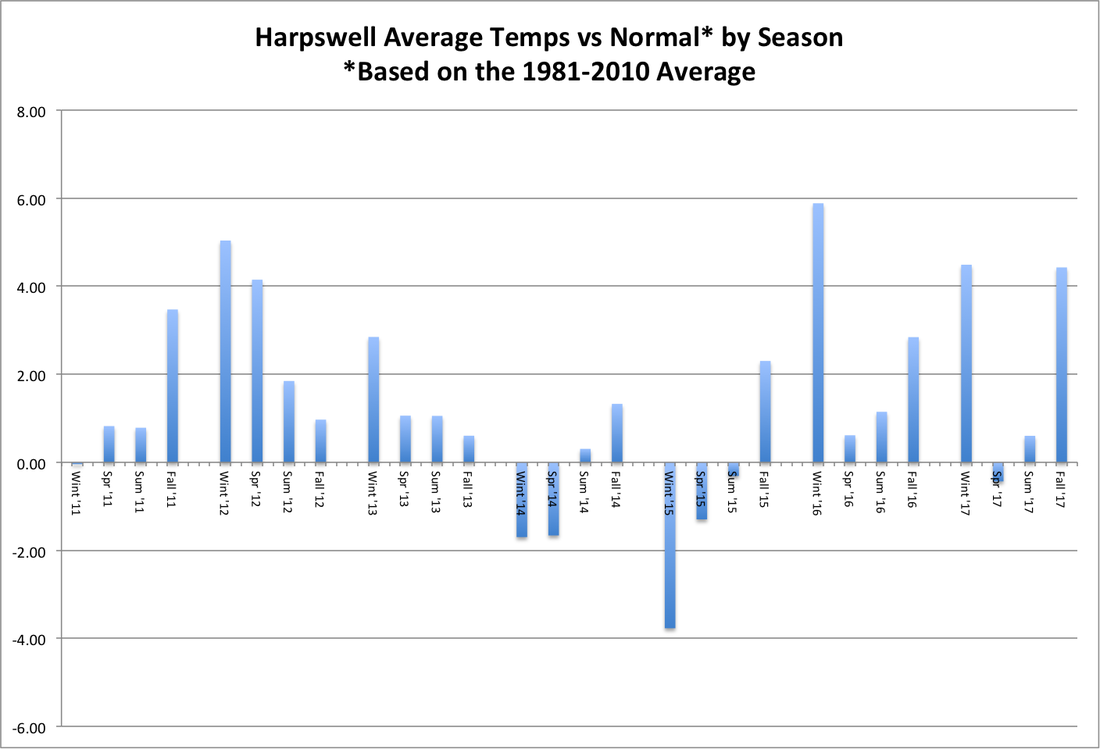
The 3rd and 4th graphs show the monthly and seasonal temperature anomalies for those seven years. If we consider a month or season outside the range of +-2 degrees from normal unusually warm or cold, we have had 32 unusually warm months (and 9 unusually warm seasons) and only 7 unusually cold months (and only unusually 1 cold season) during these years.
The 3rd and 4th graphs show the monthly and seasonal temperature anomalies for those seven years. If we consider a month or season outside the range of +-2 degrees from normal unusually warm or cold, we have had 32 unusually warm months (and 9 unusually warm seasons) and only 7 unusually cold months (and only unusually 1 cold season) during these years.
 RSS Feed
